|
Ocean State Estimation at Scripps
|
|||
Tropical Pacific Ocean State Estimation (TPOSE)TPOSE is a synthesis of observations of the tropical Pacific. It is produced by constraining a regional setup of the MIT general circulation model (MITgcm) to fit data from Argo floats, moorings, and satellites through the adjoint method (4D-Var), resulting in a physically-realistic estimate of the ocean state. For more information see Verdy, Cornuelle, Mazloff, and Rudnick, 2017: Estimation of the Tropical Pacific Ocean State 2010-2013. J. Atmos. Oceanic Technol., 34, 1501-1517 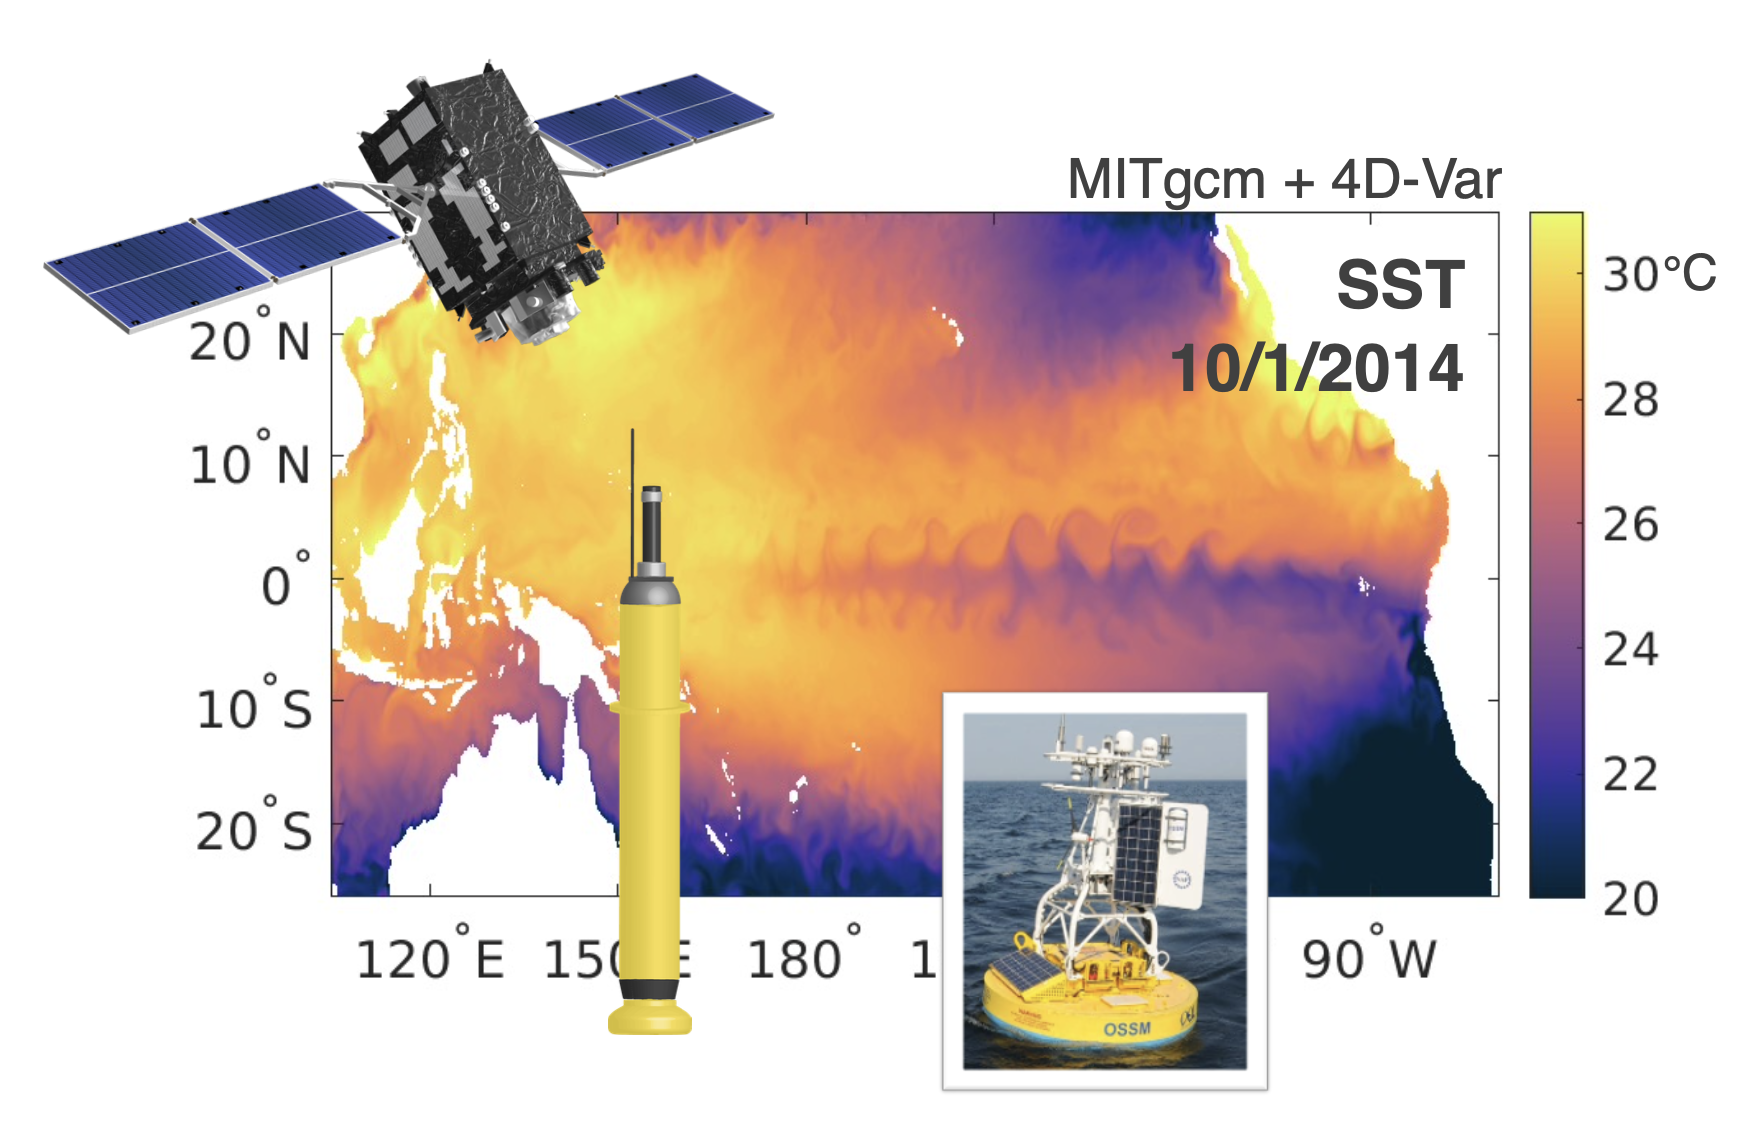
ResultsTPOSE-bgcThe state estimate is coupled to a biogeochemical model (N-BLING). BGC data is not assimilated, but is used for validation. Available output includes dissolved inorganic carbon, alkalinity, oxygen, nitrate, phosphate, iron, and chlorophyll. Additional variables may be available on request. We also have a free forward run of the BGC model, driven by ERA5 atmospheric state. TPOSE.6A new higher-resolution state estimate is being produced. It has 1/6 degree horizontal resolution and 66 vertical levels, with 2 m thickness in the upper layers.
TPOSE.3We have produced a state estimate at 1/3 degree resolution for the period 2010-2019. The output is publicly available (please cite appropriately). Some fields can be obtained by clicking on the links below; for additional diagnostics, please do not hesitate to contact us directly.
CitationWhen using this state estimate please cite: Verdy, Cornuelle, Mazloff, and Rudnick, 2017: Estimation of the Tropical Pacific Ocean State 2010-2013. J. Atmos. Oceanic Technol., 34, 1501-1517 Contact |
|||